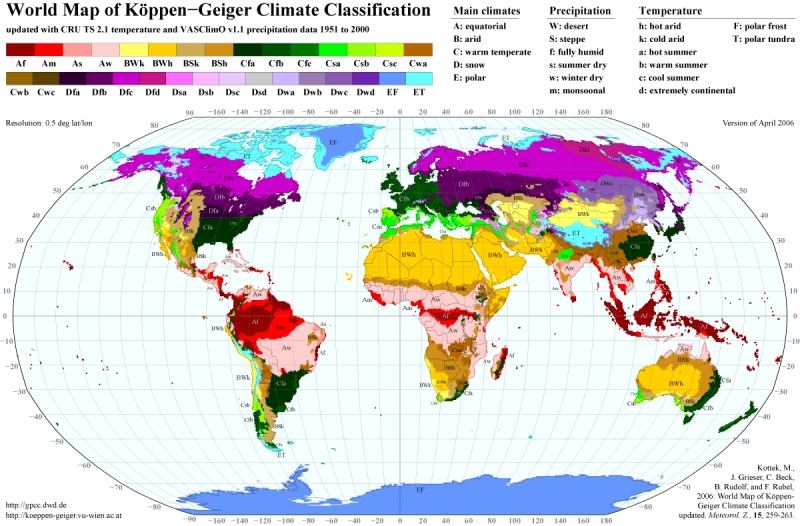
World Map of the Köppen-Geiger climate classification updated
Abstract
The most frequently used climate classification map is that of Wladimir Köppen, presented in its latest version 1961 by Rudolf Geiger. A huge number of climate studies and subsequent publications adopted this or a former release of the Köppen-Geiger map. While the climate classification concept has been widely applied to a broad range of topics in climate and climate change research as well as in physical geography, hydrology, agriculture, biology and educational aspects, a well-documented update of the world climate classification map is still missing. Based on recent data sets from the Climatic Research Unit (CRU) of the University of East Anglia and the Global Precipitation Climatology Centre (GPCC) at the German Weather Service, we present here a new digital Köppen-Geiger world map on climate classification for the second half of the 20th century.
Citation
Kottek, M., J. Grieser, C. Beck, B. Rudolf, and F. Rubel, 2006: World Map of the Köppen-Geiger climate classification updated. Meteorol. Z., 15, 259-263. DOI: 10.1127/0941-2948/2006/0130.
Map and data (version June 2006)
The Köppen-Geiger climate map is provided with a spatial resolution of 0.5 degree (30 arc minutes) representative for the 50-year period 1951-2000. The map is available as low resolution image (gif) and as high resolution vector map (pdf). Data may be downloaded as text file (ASCCI). Further data formats are available for the Köppen-Geiger climate map re-analyzed in January 2017 (next section).
Maps: gif (~ 130 kB) pdf (297 x 210 mm, ~ 1.3 MB)
Data: Koeppen-Geiger-ASCII.txt (~ 245 kB)
High resolution map and data (version March 2017)
The re-analyzed Köppen-Geiger map is provided with the higher resolution of 5 arc minutes using the downscaling algorithms described by Rubel et al. (2017). It is representative for the more recent 25-year period 1986-2010. Additionally, the colour table was optimized for the higher resolution resulting in a slightly different look of the map. Two data sets are provided: A raster file together with a R-code for individual visualization
 code with raster file: Map_KG-Global.R
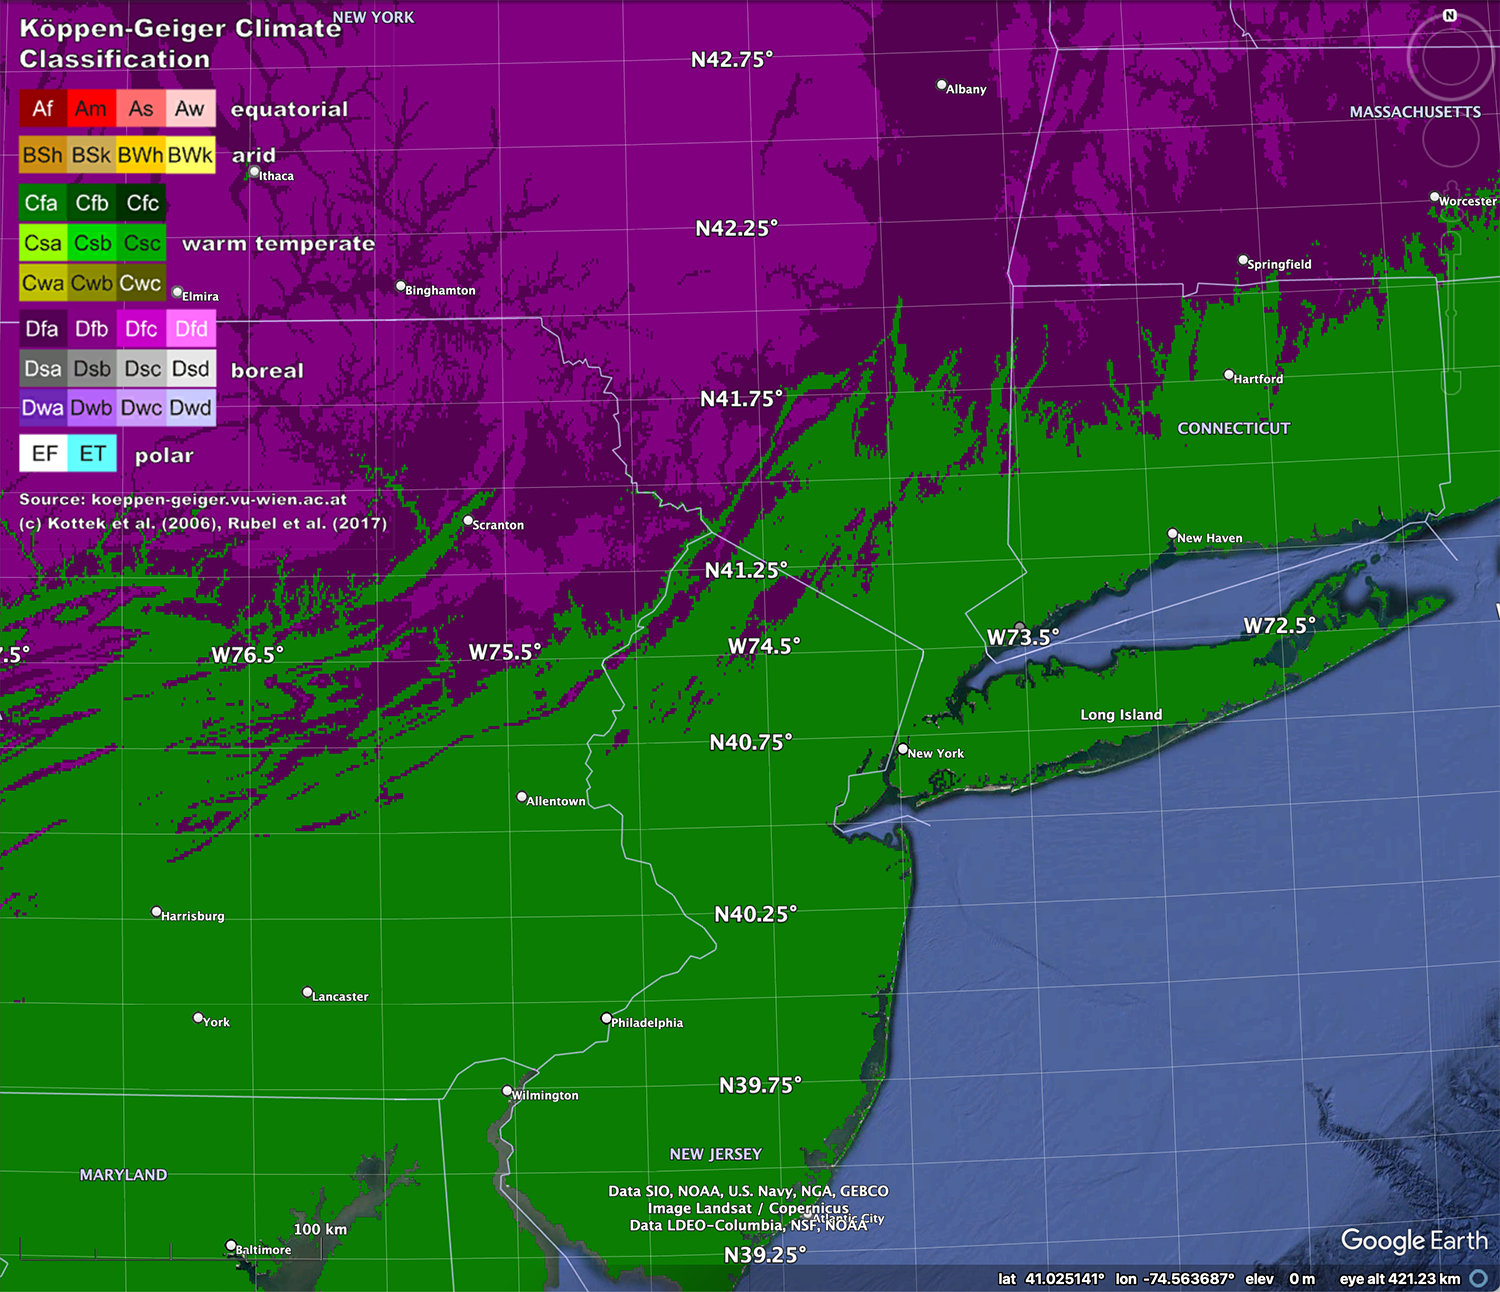
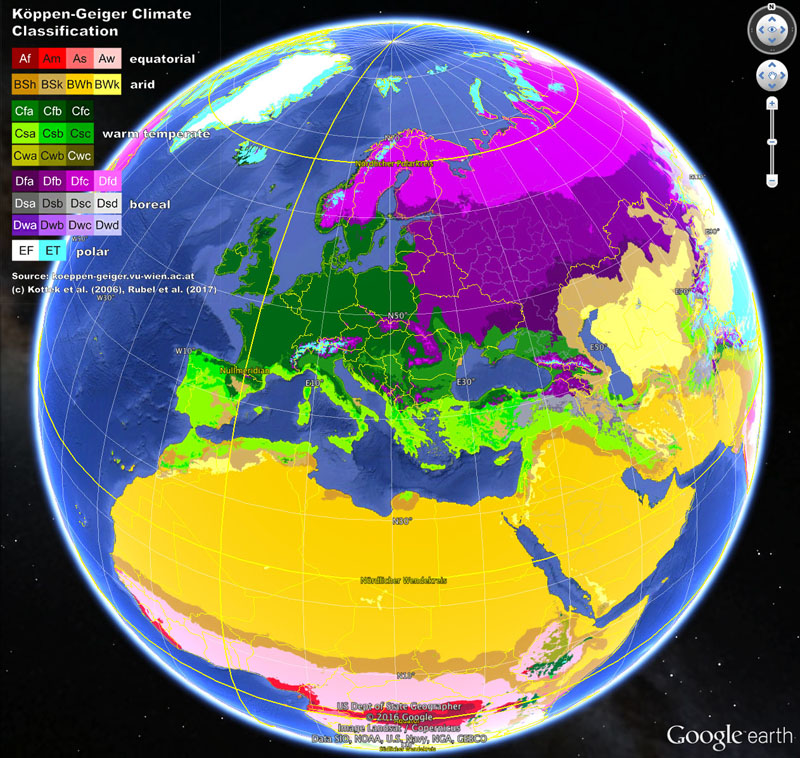
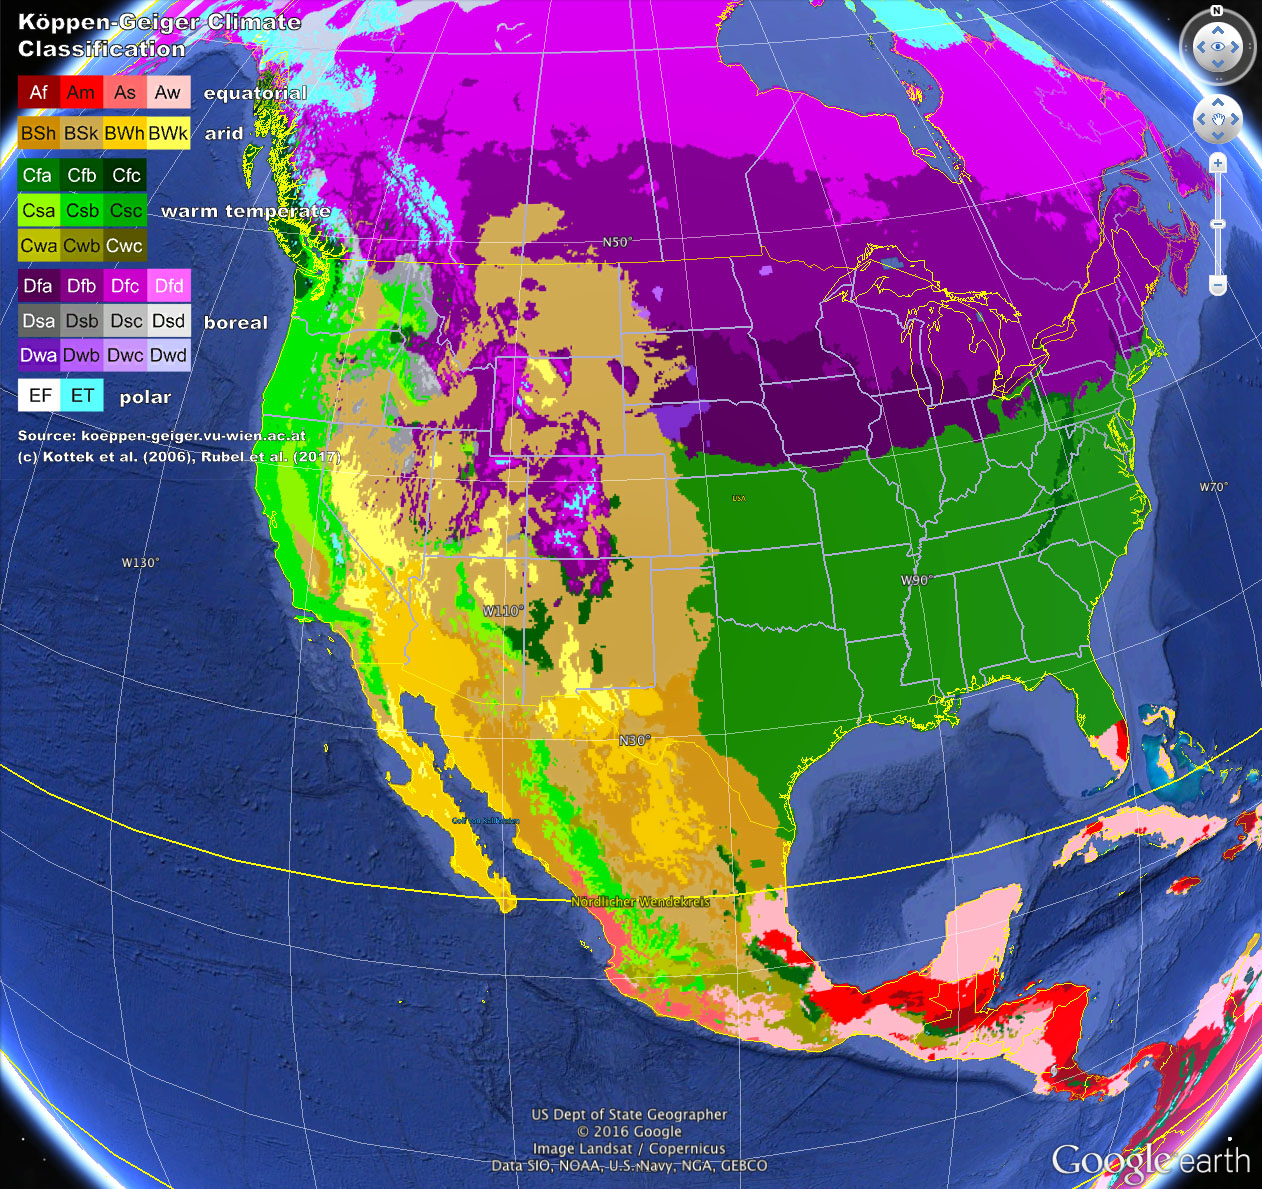
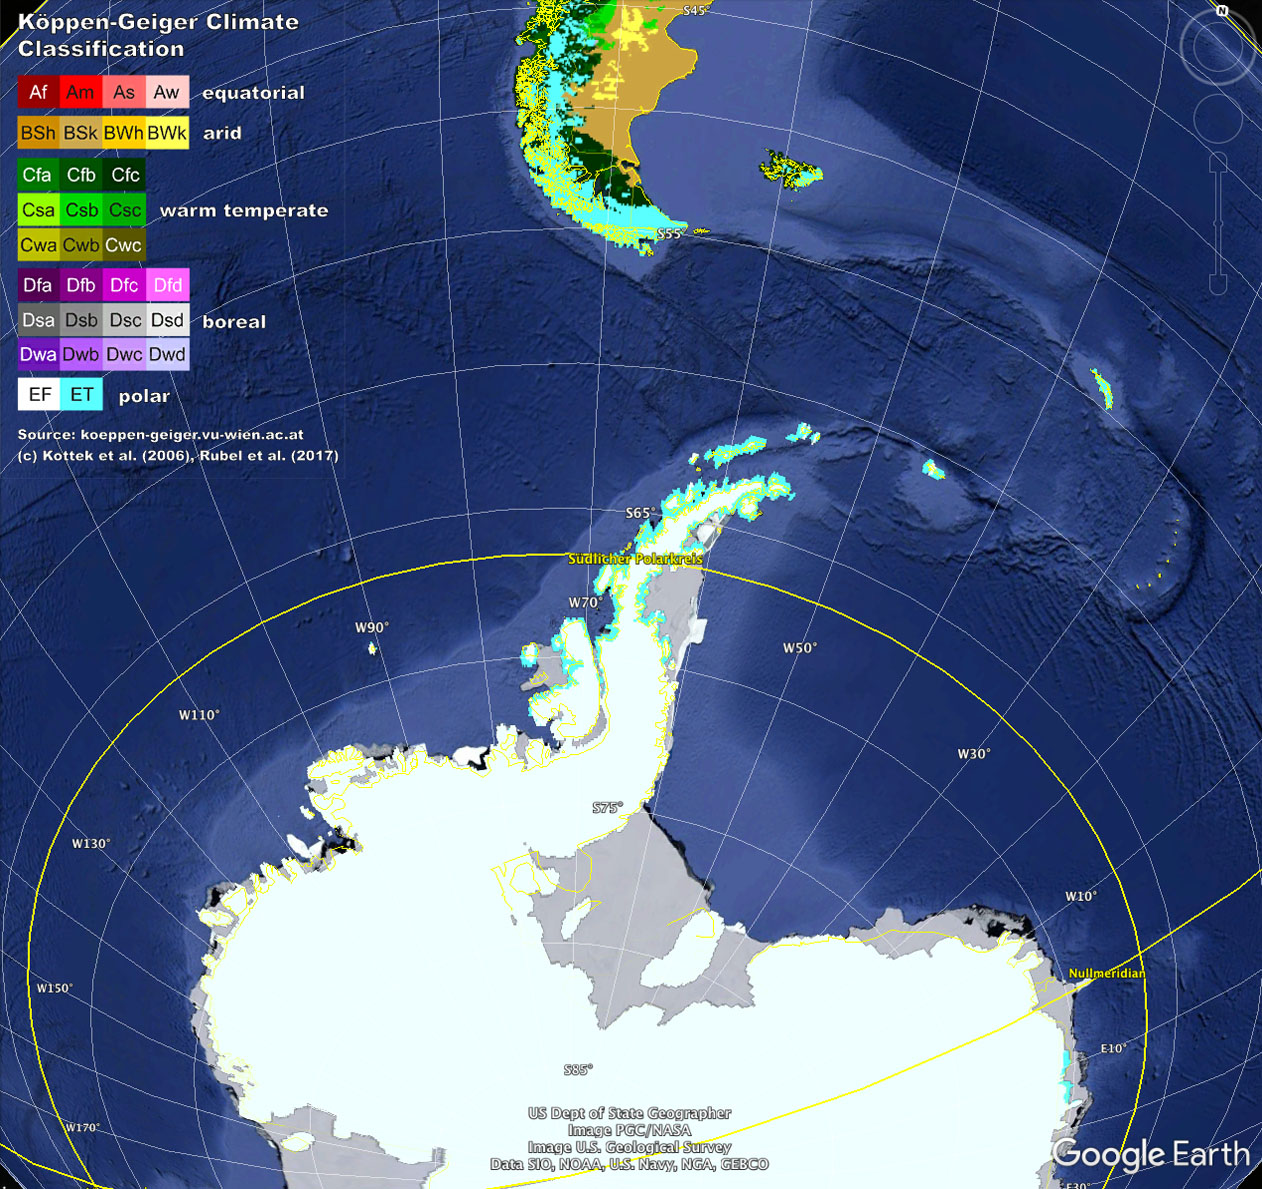
and kmz files for Google Earth. The latter are available in low (0.5 degree=30 arc min), medium (10 arc min) and high (5 arc min) resolution (see figure below), because not all computers may be able to display the large file of the high resolution map.
KMZ for Google Earth (low res): Global_1986-2010_KG_30m.kmz
KMZ for Google Earth (med res): Global_1986-2010_KG_10m.kmz
KMZ for Google Earth (high res): Global_1986-2010_KG_5m.kmz
Very high resolution map and data (version August 2023)
in preparation ...