

Observed and projected climate shifts 1901-2100
depicted by world maps of the Köppen-Geiger climate classification

Climate shift depicted by Köppen-Geiger climate classification maps (Google Earth visualization, version January 2019).
Google Earth files(.kmz):  Global_Shift_A1FI_1976-2100_30m.kmz
Abstract
In a previous paper we presented an update of the highly referenced climate classification map, that of Wladimir Köppen, which was published for the first time in 1900 and updated in its latest version by Rudolf Geiger in 1961. This updated world map of Köppen-Geiger climate classification was based on temperature and precipitation observations for the period 1951-2000. Here, we present a series of digital world maps for the extended period 1901-2100 to depict global trends in observed climate and projected climate change scenarios. World maps for the observational period 1901-2002 are based on recent data sets from the Climatic Research Unit (CRU) of the University of East Anglia and the Global Precipitation Climatology Centre (GPCC) at the German Weather Service. World maps for the period 2003-2100 are based on ensemble projections of global climate models provided by the Tyndall Centre for Climate Change Research. The main results comprise an estimation of the shifts of climate zones within the 21st century by considering different IPCC scenarios. The largest shifts between the main classes of equatorial climate (A), arid climate (B), warm temperate climate (C), snow climate (D) and polar climate (E) on global land areas are estimated as 2.6 - 3.4 % (E to D), 2.2 - 4.7 % (D to C), 1.3 - 2.0 (C to B) and 2.1 - 3.2 % (C to A).
Citation
Rubel, F., and M. Kottek, 2010: Observed and projected climate shifts 1901-2100 depicted by world maps of the Köppen-Geiger climate classification. Meteorol. Z., 19, 135-141. DOI: 10.1127/0941-2948/2010/0430.
Maps
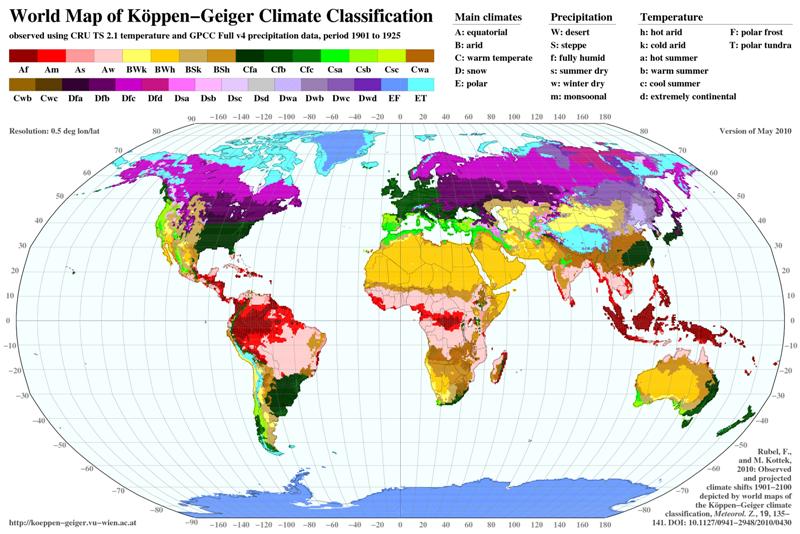
World Map of Köppen-Geiger climate classification calculated from observed temperature and precipitation data for the period 1901-1925 on a regular 0.5 degree latitude/longitude grid.
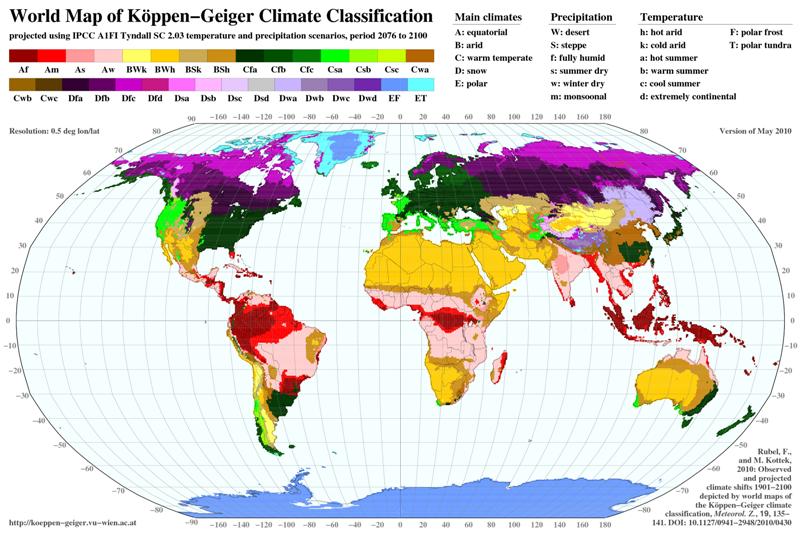
World Map of Köppen-Geiger climate classification projected with Tyndall temperature and precipitation data for the period 2076-2100, A1FI emission scenario, multi model mean, on a regular 0.5 degree latitude/longitude grid.
 Download maps of the observed and projected climate classification as gif-images (2590 x 1729 px, ~ 680 kB each):
 Download maps of the observed and projected climate classification as pdf-files (914 x 610 mm, ~ 1.5 MB each):
Movies
View movies of sliding 25-years means of the Köppen-Geiger climate classification for the observed period 1901-2000 as well as for the projected period 1976-2100. To view the movies a QuickTime Player is recommended.
| Observed | A1FI | A2 | B1 | B2 |
| 1901-2000 | 1976-2100 | 1976-2100 | 1976-2100 | 1976-2100 |
Data
 The underlying data of the here presented Köppen-Geiger climate classification maps are available for free for use in scientific research and can be obtained as zipped ASCII-files (~ 245 kB each):
These zip-archives contain in each case one text file (ASCII text with CRLF line terminators) including the climate classification map on a regular 0.5 degree lat/lon grid for the determined period and determined IPPC emission scenario, multi model mean, respectively. Each text file contains two lines of header followed by 91828 lines of grid box center coordinates (latitude, longitude) with corresponding climate class abbreviated according to the climate classification established by Köppen and Geiger. The data are available on the global land areas.
 For use in GIS software a copy of these data in shape format is available:
Each zip archive contains the shape file for the respective period and emission scenario plus a corresponding layer file. The scheme how to convert the integers to climate classes can be found here.